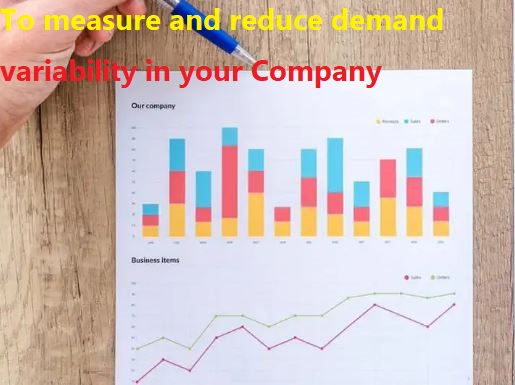
One common way to measure demand and supply variability is to use the coefficient of variation (CV), which is the ratio of the standard deviation to the mean of a data set. The higher the CV, the higher the variability. For example, if the average monthly demand for a product is 100 units, and the standard deviation is 20 units, the CV is 0.2. This means that the demand varies by 20% around the mean. Similarly, if the average monthly supply for a product is 100 units, and the standard deviation is 10 units, the CV is 0.1. This means that the supply varies by 10% around the mean.
Reducing demand and supply
Reducing demand and supply variability can help improve customer satisfaction, operational efficiency, and profitability. To achieve this, forecasting demand more accurately using historical data, market research, and customer feedback is recommended. Additionally, aligning supply with demand using flexible production systems, inventory management, and supplier collaboration can help reduce variability. Smoothing demand using pricing, incentives, and marketing strategies to balance demand across different periods and segments is also beneficial. Finally, buffering against variability using safety stock, backup suppliers, and contingency plans to cope with unexpected fluctuations can help further reduce variability.
To monitor and improve your variability
To monitor and improve your variability performance, you should track and analyze key metrics such as demand forecast accuracy, supply fill rate, inventory turnover, stockout rate, and variability cost. Benchmarking these metrics against industry standards and best practices can help you identify areas for improvement. Additionally, communication and collaboration with customers and suppliers is essential for sharing information, coordinating plans, and resolving issues.
Assessing disruption is more than a checklist. It’s a nuanced examination beyond immediate impacts. Quantify not just duration and severity, but the ripple effects on costs, prices, and market dynamics. The scope extends beyond your walls—scrutinize how competitors fare. Data isn’t just numbers; it’s a narrative. In navigating disruption, depth of understanding is currency. The true assessment isn’t a snapshot; it’s a dynamic storyline. Assemble a mosaic of insights, not just facts, to navigate the turbulence. The depth of your comprehension determines not just survival but mastery in the face of upheaval.
The final step
The final step is to review your forecasting processes and identify areas for improvement. You need to evaluate how well your forecasting methods, tools, and systems cope with the disruption and how they can be enhanced or replaced.
You need to assess how well your forecasting team, organization, and culture support your forecasting objectives and how they can be developed or changed. You need to examine how well your forecasting practices align with your business strategy and goals and how they can be integrated or aligned.


